
Menu
Open source
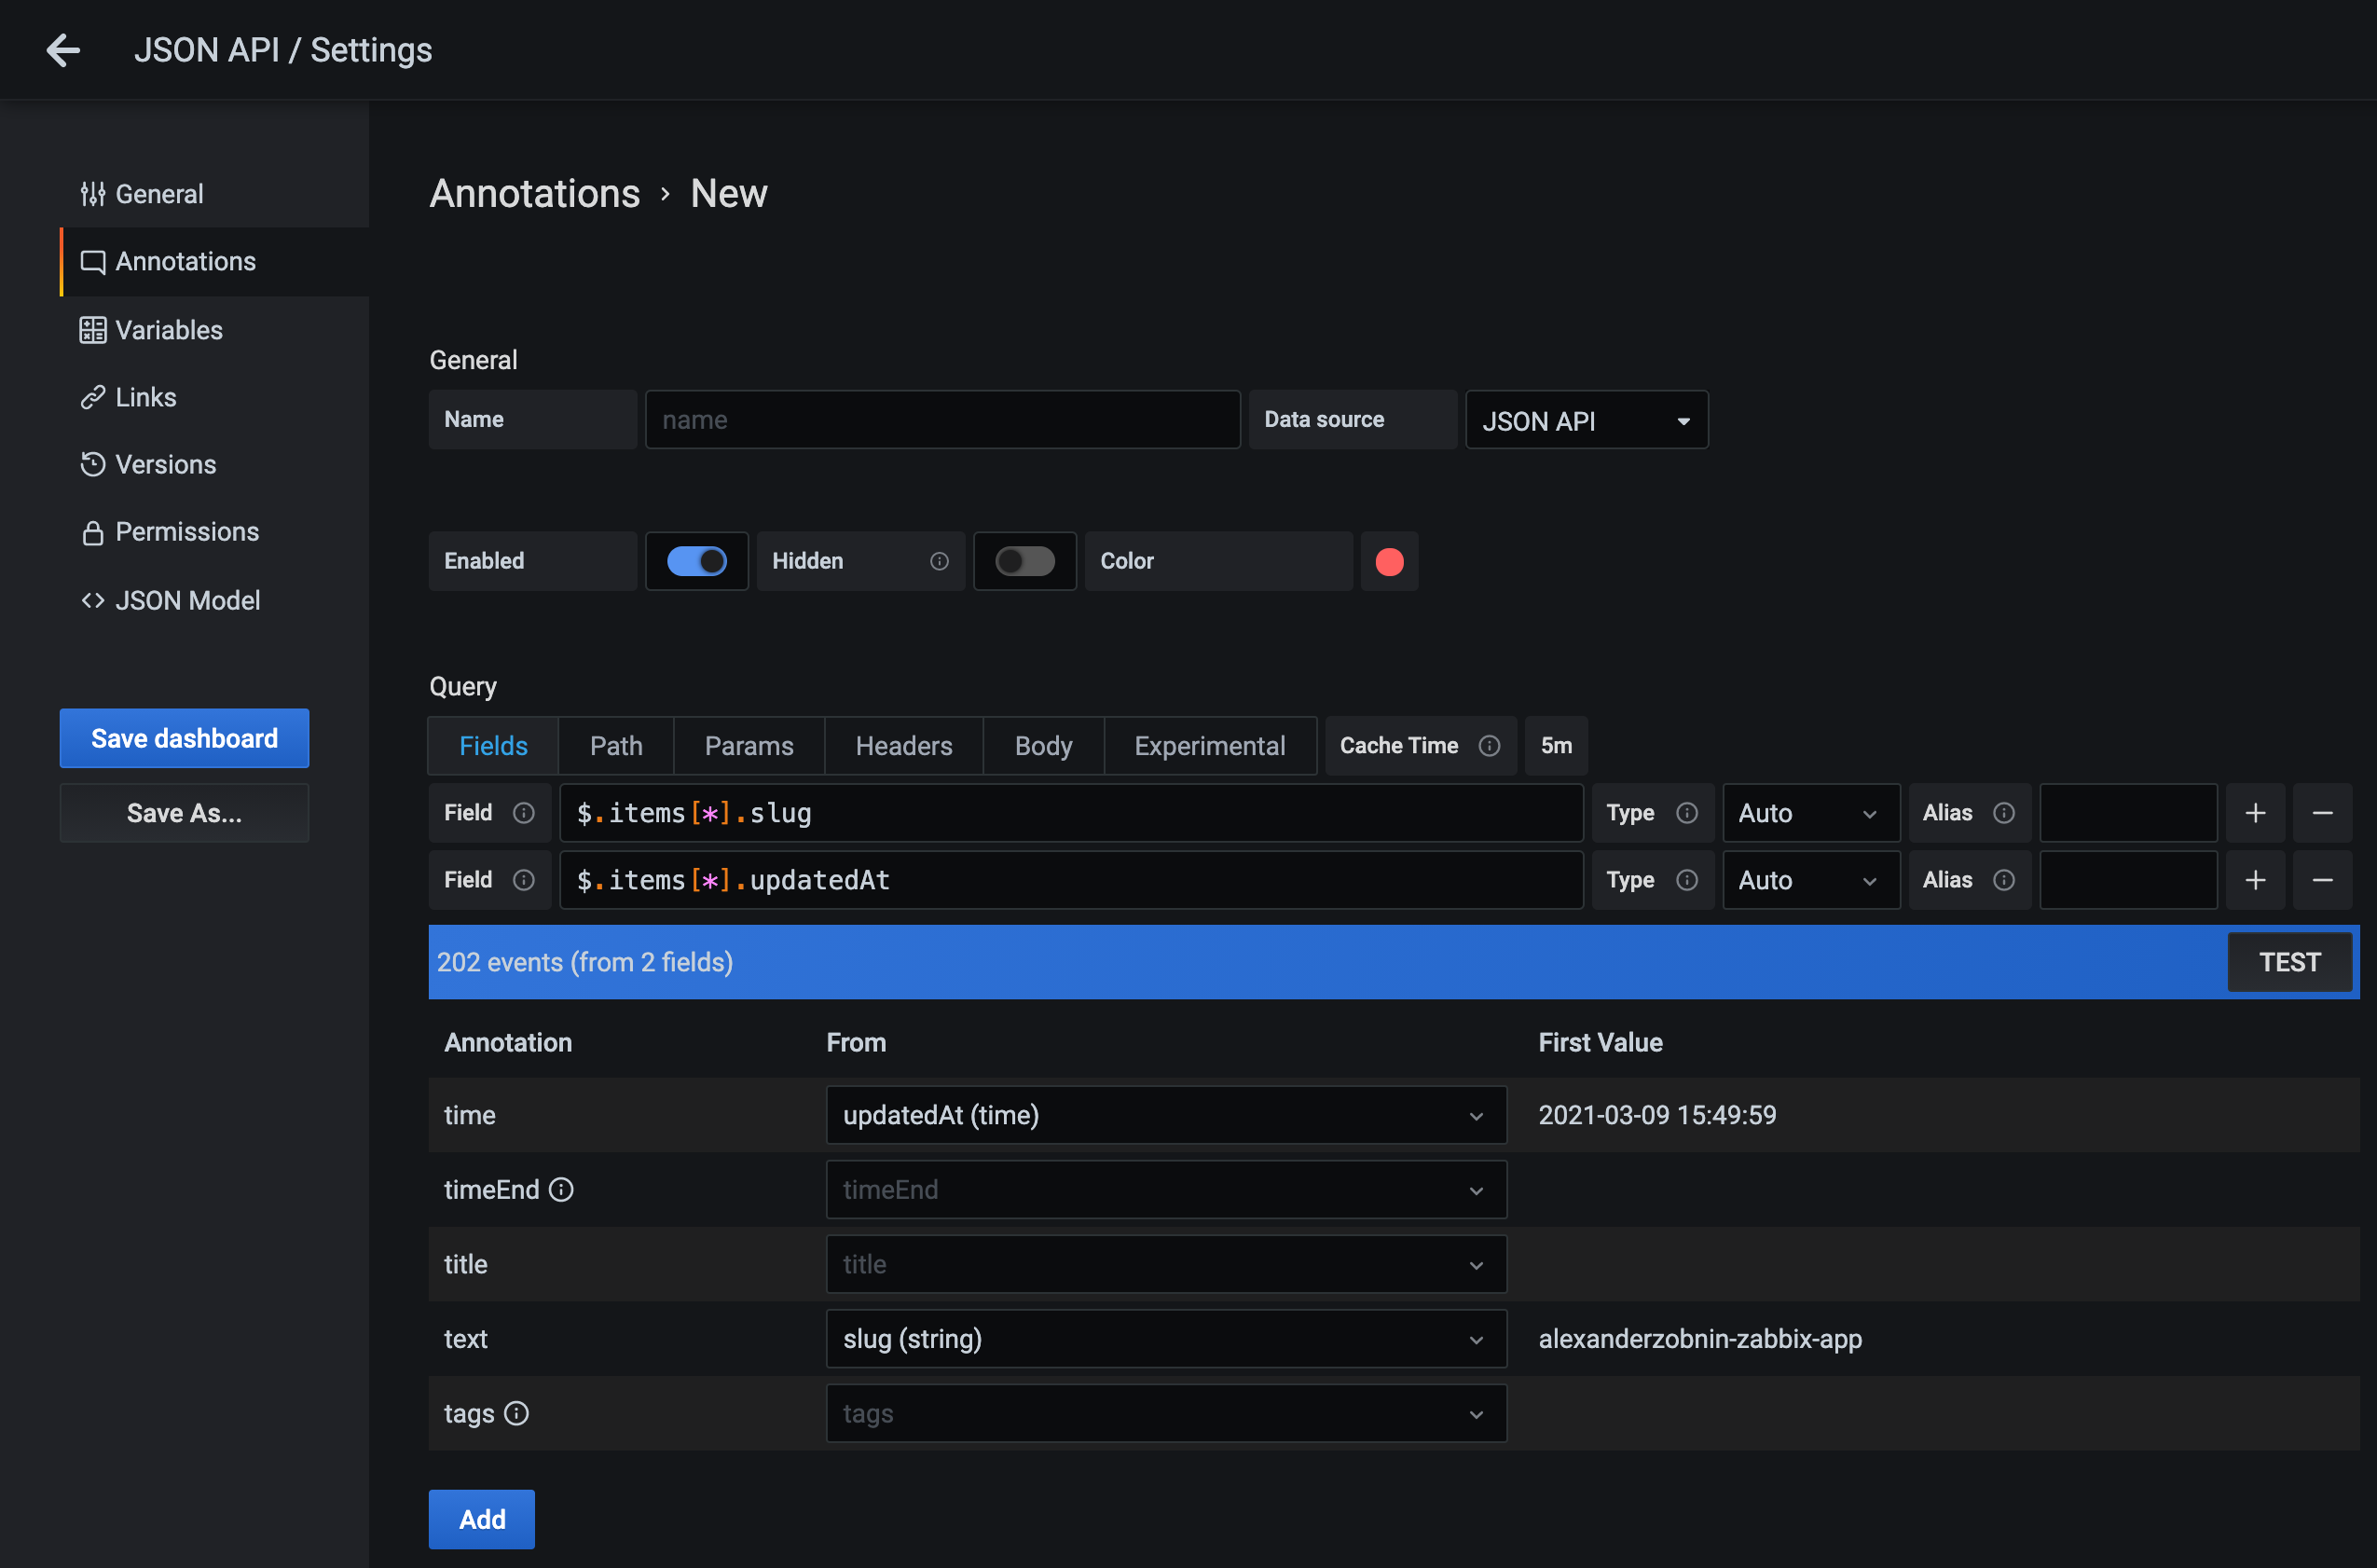
Annotations let you extract data from a data source and use it to annotate a dashboard.
Info: Annotations support was added in v1.0.1. If you can’t select the JSON API data source from the list of data sources, try updating to a more recent version.
To use the JSON API data source for annotations, follow the instructions on Querying other data sources. Make sure to select the JSON API from the list of data sources.
Configure a query with at least two fields:
- A String field for the annotation text
- A Time field for the annotation time
If you want to add titles or tags to the annotations, you can add additional Fields with the appropriate types.
For more information on how to configure a query, refer to Query editor.
Was this page helpful?
Related resources from Grafana Labs

Unify your data with Grafana plugins: Datadog, Splunk, MongoDB, and more
In this webinar, learn how to leverage Grafana's plugin ecosystem for access to 80+ data sources, including plugins for Datadog, Splunk, MongoDB, and more.

Grafana plugins demo: GitHub, GitLab, JIRA, ServiceNow, and more
In this webinar, we'll show you how to use Grafana to unlock these insights and have better visibility into the performance of your software development team.

All about Grafana plugins: Visualizing disparate data sources in one place
Grafana Enterprise plugins are integrations with other commercial monitoring tools (such as Datadog, Splunk, New Relic, ServiceNow, Oracle, and Dynatrace) that are created, maintained, and supported by the Grafana Labs team.