
Continuous profiling for better application performance
Grafana Cloud Profiles is a hosted continuous profiling tool that gives you a cost-efficient way to better understand the resource usage of code. Powered by Grafana Pyroscope, Cloud Profiles enables you to optimize infrastructure spend, simplify debugging, and enhance application performance.
A free plan that’s actually useful
 50GB profiles
14-day retention
3 monthly active users
50GB profiles
14-day retention
3 monthly active usersReduce costs
Spot CPU spikes, memory leaks, and other inefficiencies with code-level visibility into resource usage. Teams can then optimize their code and lower infrastructure costs.
Decrease latency
Maintain high speed and efficiency and improve application performance. In a competitive digital world, decreasing latency translates to increasing revenue.
Resolve incidents faster
Cut down the mean time to resolution (MTTR) by correlating continuous profiling data with metrics, logs, and traces to quickly identify the root cause of any issue.
What is continuous profiling?
Continuous profiling, which is often described as the “fourth pillar of observability,” provides in-depth insights into resource usage and latency down to the code level. But rather than simply being another addition to your observability stack, continuous profiling brings together metrics, logs, and traces in new ways, representing a key step in unifying the traditional pillars of observability.
Continuous profiling offers a dynamic, time-oriented perspective on resource usage. This approach helps developers optimize infrastructure spend more effectively, simplifies debugging, and enhances the overall understanding of an application’s performance.

Why use Grafana Cloud for continuous profiling?
Optimize code for better resource efficiency
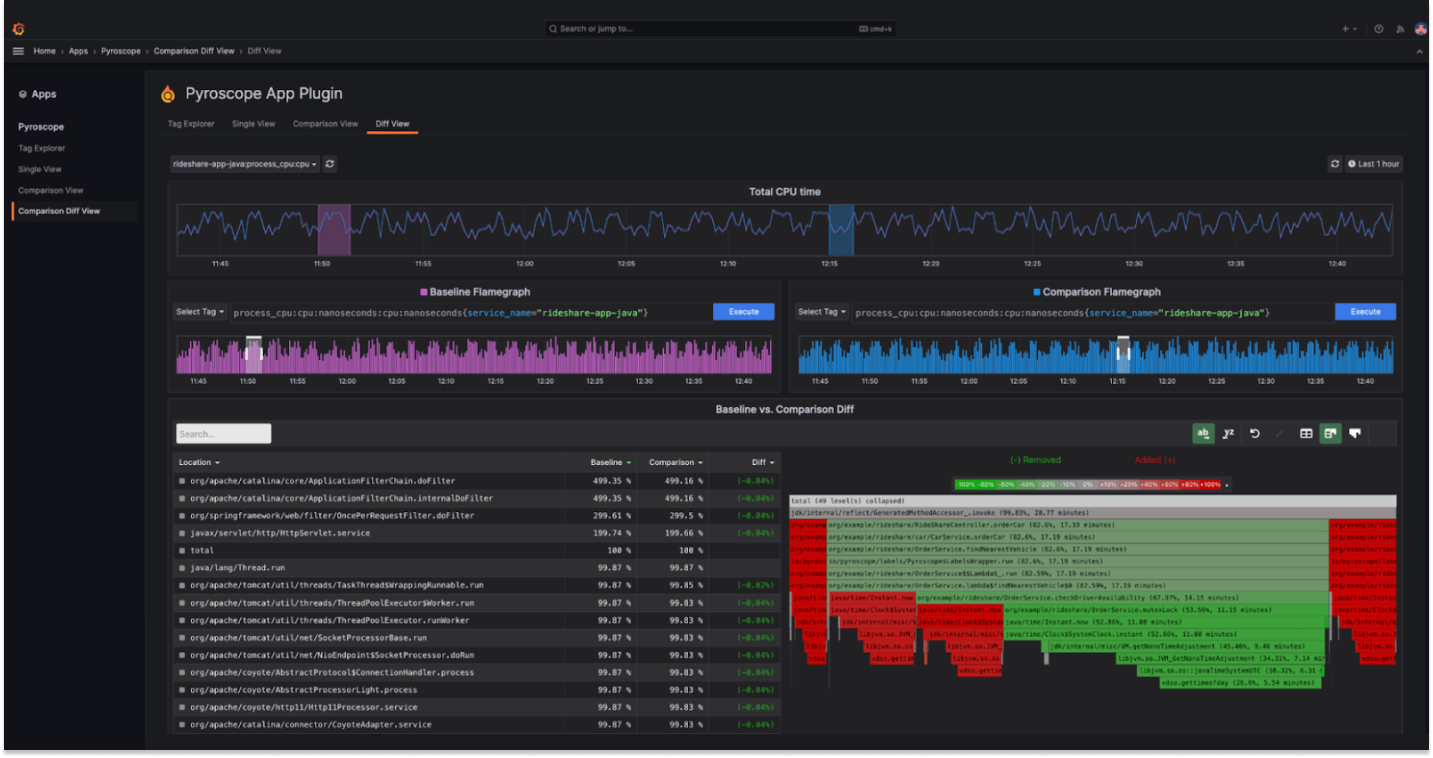
Identify and analyze application performance hotspots more intuitively with the App Plugin View. Teams can then write better code to increase application performance, decrease infrastructure costs, and create a high-quality user experience.
- Label explorer view shows which labels are consuming the most resources.
- Flame graph diffs calculate the differential between two time periods or label sets and pinpoints where problem areas exist.
- Get line-level code exports for profile-guided optimization (PGO) and pprof.
- Flame graph AI uses LLM to help you better understand profiling data and identify bottlenecks, root causes, and suggested fixes faster.
Correlate data across your observability stack
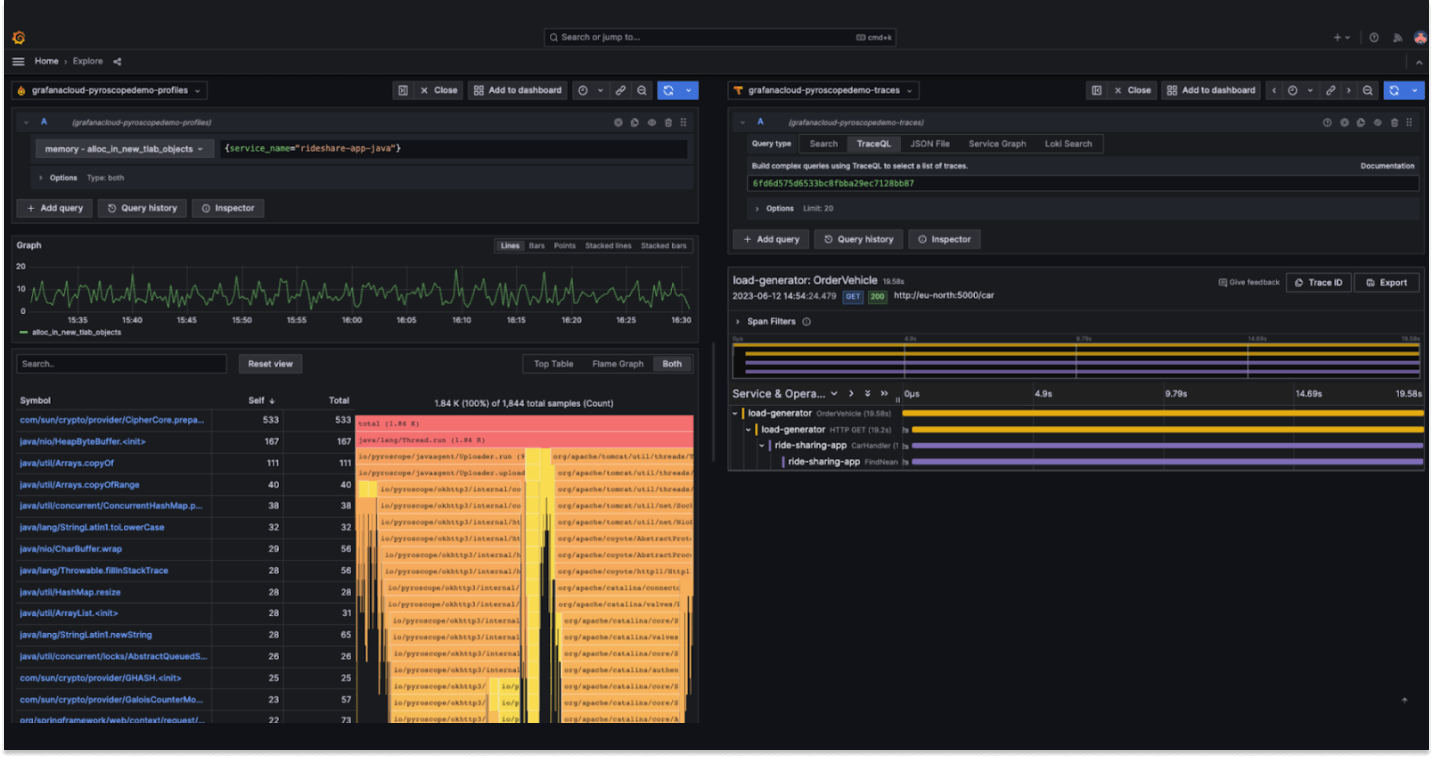
Get full visibility into your profiling data and correlate it with logs, metrics, traces, and other data sources with the Explore View, which provides a holistic view of your system’s behavior.
- Analyze profiling data alongside other telemetry.
- Easily navigate between different data sources with time-synced views.
- Dive deeper into specific profiles with targeted query support.
- Choose from a variety of flame graph visualizations for your profiling data.
Build custom dashboards
Get an at-a-glance overview of your profiling data with the Dashboard View, which gives you insight into your application performance over time and helps monitor your key performance indicators.
- Set up customized panels with the metrics that matter.
- Visualize key performance indicators in a single view.
- Share dashboards among team members, facilitating collaboration and a data-driven culture.

It’s easy to get started
Configure your client
Send profiling data
Get continuous profiling fully managed with Grafana Cloud
Cloud FreeNo payment. Ever.
- 50GB profiles.
- 3 active monthly users.
- Always free. Never expires. Upgrade at any time.